Claude now builds videos and live dashboards straight from text prompts
Anthropic adds two creative tools — one for motion graphics, another for live data — expanding what Claude can do beyond chat.
Anthropic has launched two new beta features for Claude that let users create animated explainer videos and live data dashboards using only text prompts.
The first tool, called Motion, turns text, diagrams, and images into animated explainer videos. Users can edit the videos as code and export them as MP4 files. Motion is available to subscribers on Claude Team and Enterprise plans.
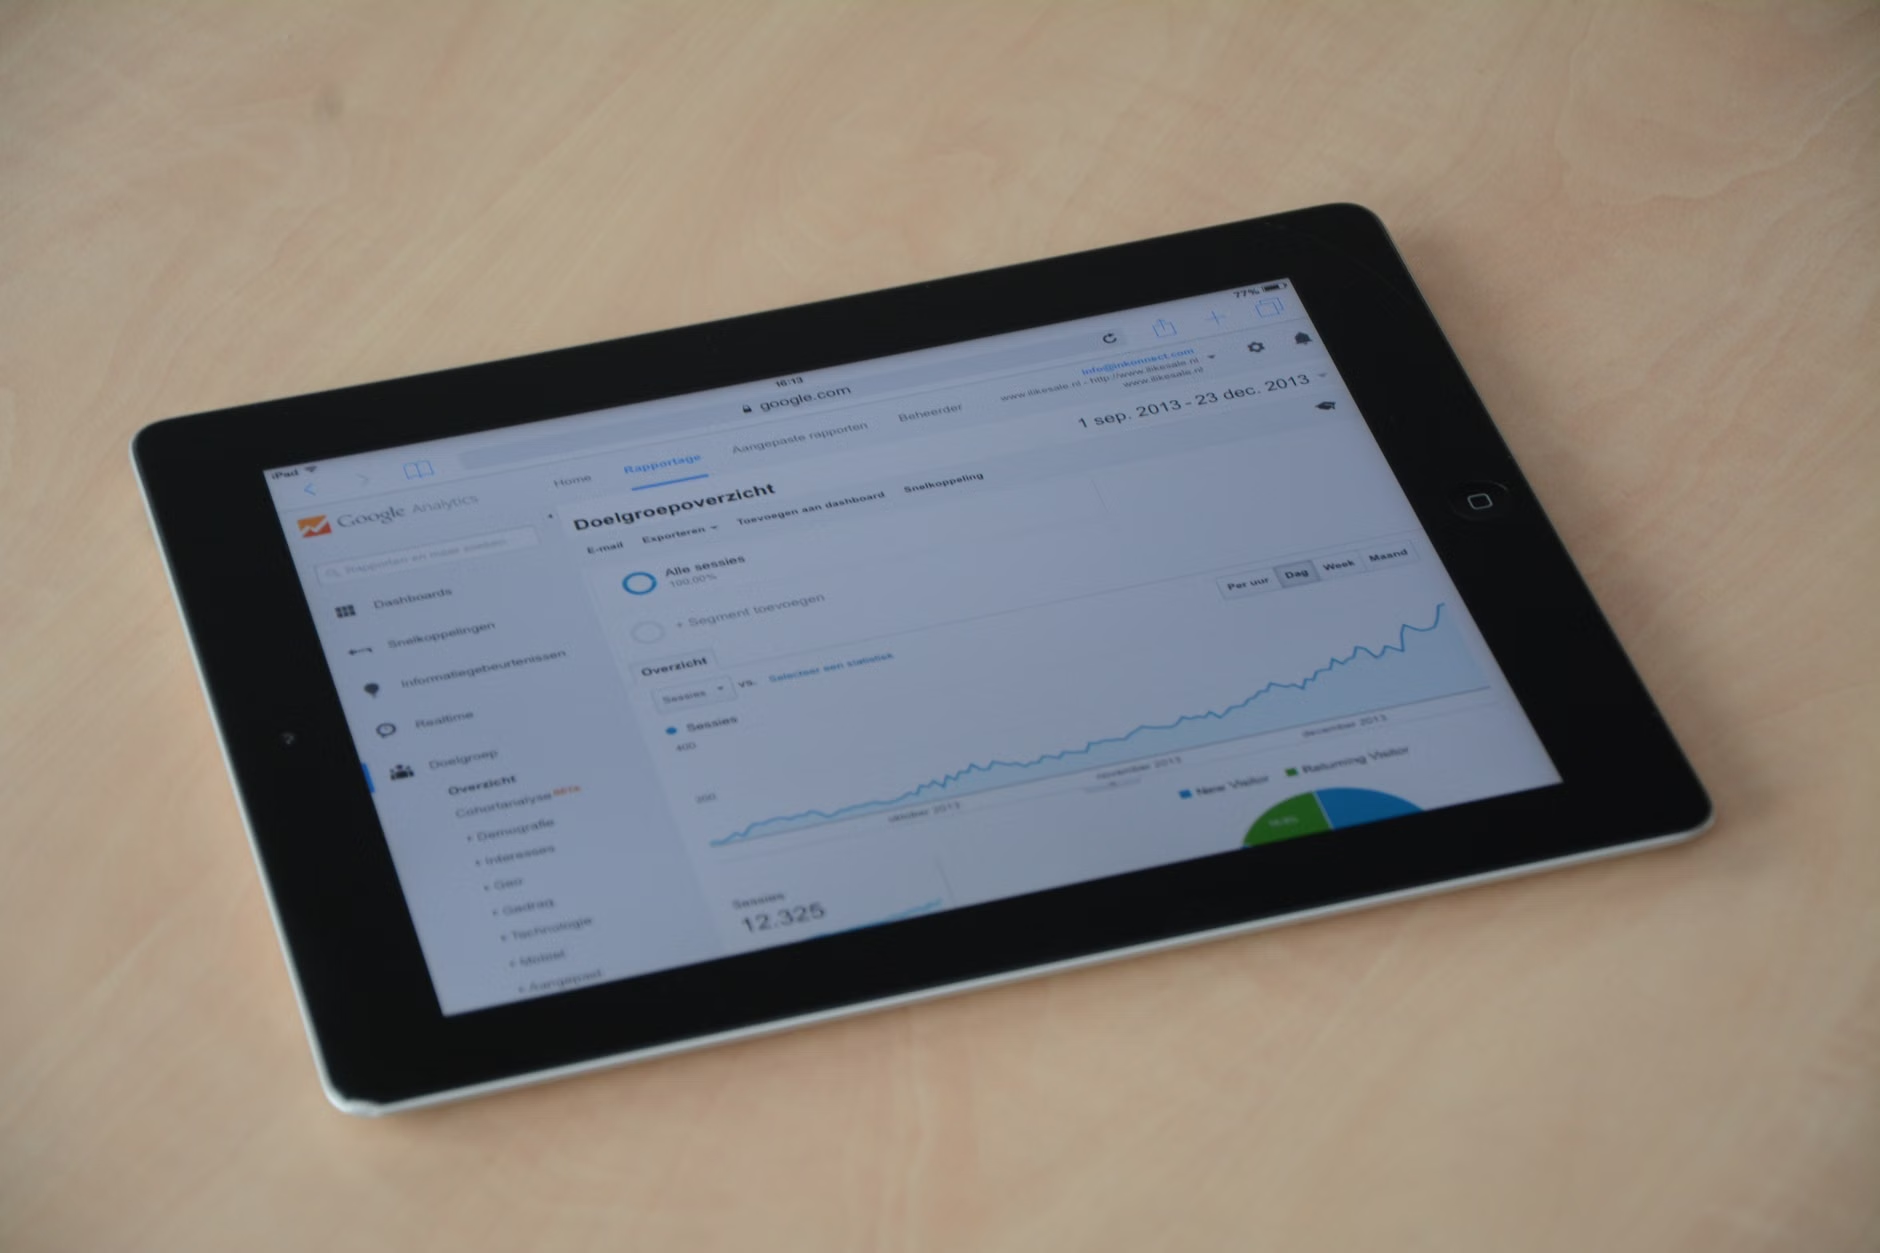
The second tool, called Dashboards, connects to data platforms like BigQuery, Databricks, Snowflake, or Salesforce and turns them into auto-updating dashboards you can control entirely through text prompts. Every number on a dashboard shows the underlying query that created it, and results can be sent to other tools like Amplitude, Grafana, or Hex. Dashboards is available to paid Claude users more broadly.
These launches come as Anthropic is also opening up its earlier tools. Docs, Slides, and Design are leaving beta and now work on all plans, including free accounts. Anthropic says more than 45 million documents have been created with those features 1.
Another change is on the horizon: Claude Design will be folded into the main Claude app by December 14. A migration guide has already been published for users who want to move their work.
While not every company seems ready to embrace Claude at scale, reports suggest Microsoft is reportedly cutting back on its usage of the model.
Still, Anthropic continues to push the boundaries of what Claude can handle.
The combination of visual creation, data integration, and scientific tools marks a notable shift — Claude is becoming less of a pure conversational assistant and more of a full creative and analytical workspace.
Corrections and updates
- Corrected on 23 October 2026. An earlier version said an astrophysicist used Claude Science to create the first complete ultraviolet map of the sky; the source does not mention this claim. An earlier version said the cutting back was raising questions about long-term customer retention; the source only reported that Microsoft is reportedly cutting back on Claude usage, without mentioning retention concerns.
Key facts
- Motion creates animated explainer videos from text, diagrams, and images, exportable as MP4
- Dashboards connects BigQuery, Databricks, Snowflake, or Salesforce to auto-updating dashboards via text prompts
- Docs, Slides, and Design now work on all plans after leaving beta, with 45M documents created
- Claude Design will be folded into the main app by December 14
Seen on social
An astrophysicist worked with Claude Science to create the first complete ultraviolet map of the sky. Astronomers have already created complete sky maps from radio to gamma rays. But large regions of the sky have never been observed in UV. In today’s science blog, Brice Ménard…
— Anthropic on X, see the post
Sources
- Claude can now generate animated explainer videos and live data dashboards from text prompts — the-decoder.com
Watch
If this story concerns you or your company, or uses something that belongs to you, ask for a correction or for it to be taken down. How requests work
Keep reading
 Apps and productsJ.Crew launches an AI stylist powered by Anthropic's Claude modelsHerald of AI
J.Crew launches an AI stylist powered by Anthropic's Claude models
Shoppers in the US can now describe an occasion and get a full outfit from J.Crew — all using Claude instead of hunting for each piece one by one.
 The weekThis Week in AI New Models Flood In and Agents Get SaferHerald of AI
This Week in AI New Models Flood In and Agents Get Safer
Big open-weight releases, speed breakthroughs, and a push to make AI agents more reliable and secure.
 Apps and productsAnthropic launches free AI scanner to protect open-source codeHerald of AI
Anthropic launches free AI scanner to protect open-source code
The new tool automatically finds security flaws in open-source projects so maintainers can patch them before attackers exploit them.