Same AI request makes 8.5 times more pollution in Texas than in Sweden
Where your AI runs matters for the climate — a method now lets you see the real carbon footprint of each request.
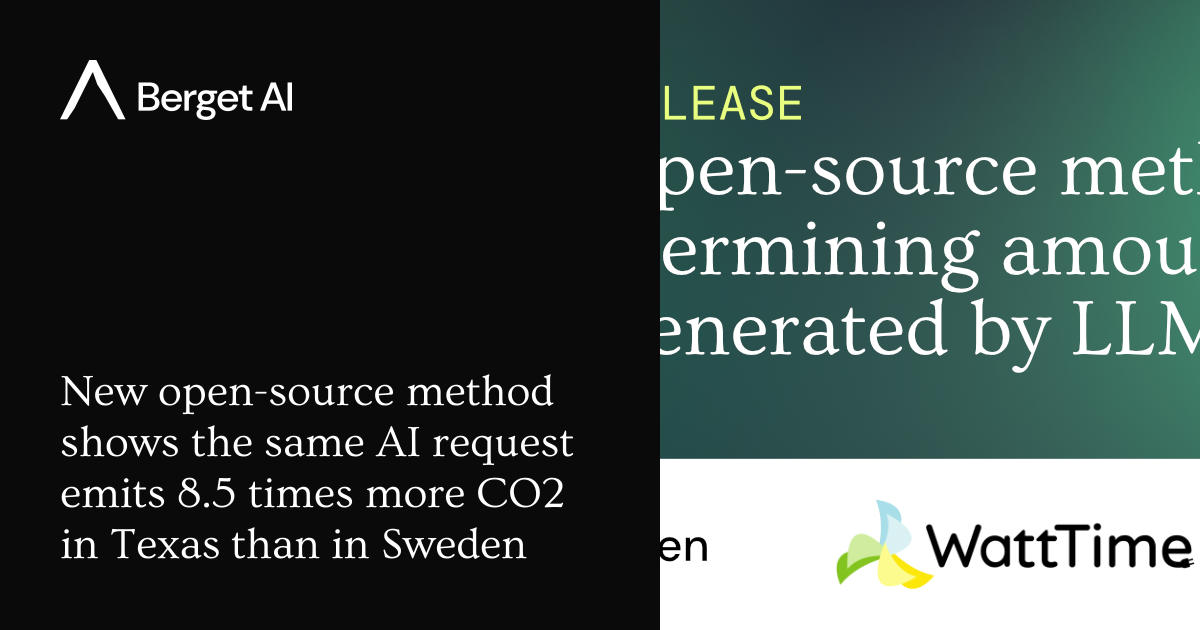
An open-source calculator that shows how much pollution one AI request makes depending on which country powers the servers.
- You type a question into an AI service.
- The tool checks where the server is located.
- It looks at the time and model being used.
- It calculates the exact CO₂ for that request.
What you could do with it
- A customer using Berget AI's console could follow their own emissions request by request as they use the service 1.
- A buyer could compare different AI providers on real carbon figures instead of marketing claims 1.
- A researcher could analyze how a request's emissions change based on the model used, time of day, and whether the prompt is cached 1.
Picture: berget.ai
Why location changes everything
If you run a normal question through the open Kimi K3 model on identical equipment, the carbon dioxide emitted depends on where the servers are: Sweden generates 0.38 grams, Ireland 1.6 grams, Germany 2.5 grams, and Texas 3.2 grams 1. That is an 8.5 times difference.
The main reason is the electricity mix. Sweden's grid runs mostly on nuclear and hydroelectric power, giving it an emissions intensity of around 8 grams of CO₂ per kilowatt-hour 1. Texas, by contrast, still relies heavily on natural gas and coal, with an intensity of about 333 grams per kilowatt-hour .
The method also accounts for the carbon cost of building the hardware. About 89% of a request's footprint in Sweden comes from manufacturing the GPU, while in Texas 90% comes from electricity 1. Over a seven-day stretch in a live production setting, a B300 that is sitting idle still uses 236 W .
Same AI request, very different pollution depending on where servers run
CO₂ emitted per single Kimi K3 request on identical hardware, by grid electricity mix
Who made the method and why
The tool was developed by Swedish AI provider Berget AI together with researchers from the Stockholm Environment Institute, and the nonprofits WattTime and Klimatkollen 1. It is published freely under an open licence on GitHub .
Berget AI says most companies using AI today have no way of knowing how much pollution their requests produce. With this method, customers can watch their own emissions request by request inside Berget AI's console 1. The company wants other providers to adopt similar reporting so buyers can compare real numbers instead of marketing claims .
"We know most European buyers would choose differently if they could see the numbers," said Andreas Lundmark, chief executive of Berget AI 1.
Why this is different from past estimates
Most public figures on AI's carbon footprint are calculated by multiplying an average emission rate by an estimated volume of use. Those numbers cannot be checked or compared properly 1.
The updated approach works out the emissions for every single request individually, factoring in which model is being used, what time of day it runs, and whether some of the prompt is already held in cache 1. It follows the Green Software Foundation's specification for measuring AI emissions .
Klimatkollen's Garbo AI assistant, which runs on Berget AI's infrastructure, is already being measured with this method 1.
What the data centres will look like in future
The International Energy Agency estimates that data centre electricity use will more than double to around 945 terawatt-hours by 2030, driven mainly by AI 1. Researchers say any efficiency gains are likely to be outweighed by higher demand, which means where the electricity comes from will matter even more .
Somya Joshi, research director at the Stockholm Environment Institute, said methodologies like this provide a transparent basis for informed decisions 1.
An updated version of the calculator will also include marginal emission rates next month, which measure the impact of adding new load to a grid rather than just using averages 1. That could change the reported numbers for Sweden significantly.
The current version does not yet cover the water and energy footprint of chip manufacturing, and training emissions are excluded because self-reported figures vary too much 1.
This story reports on a trend for information only. It is not advice or encouragement to do any of it.
Key facts
- Same Kimi K3 request: 0.38g CO₂ in Sweden, 3.2g in Texas
- Sweden grid: ~8g CO₂/kWh; Texas grid: ~333g CO₂/kWh
- Open-source method available on GitHub under MIT licence
- Data centre electricity use could double to 945 TWh by 2030
- 29% of tokens on Vercel's AI Gateway were open-weight models in June 2026
Sources
If this story concerns you or your company, or uses something that belongs to you, ask for a correction or for it to be taken down. How requests work
Keep reading
 New modelsKimi K3.1 Pro, a Chinese AI model anyone will be able to download, nearly matches Claude Opus 5.5Herald of AI
Kimi K3.1 Pro, a Chinese AI model anyone will be able to download, nearly matches Claude Opus 5.5
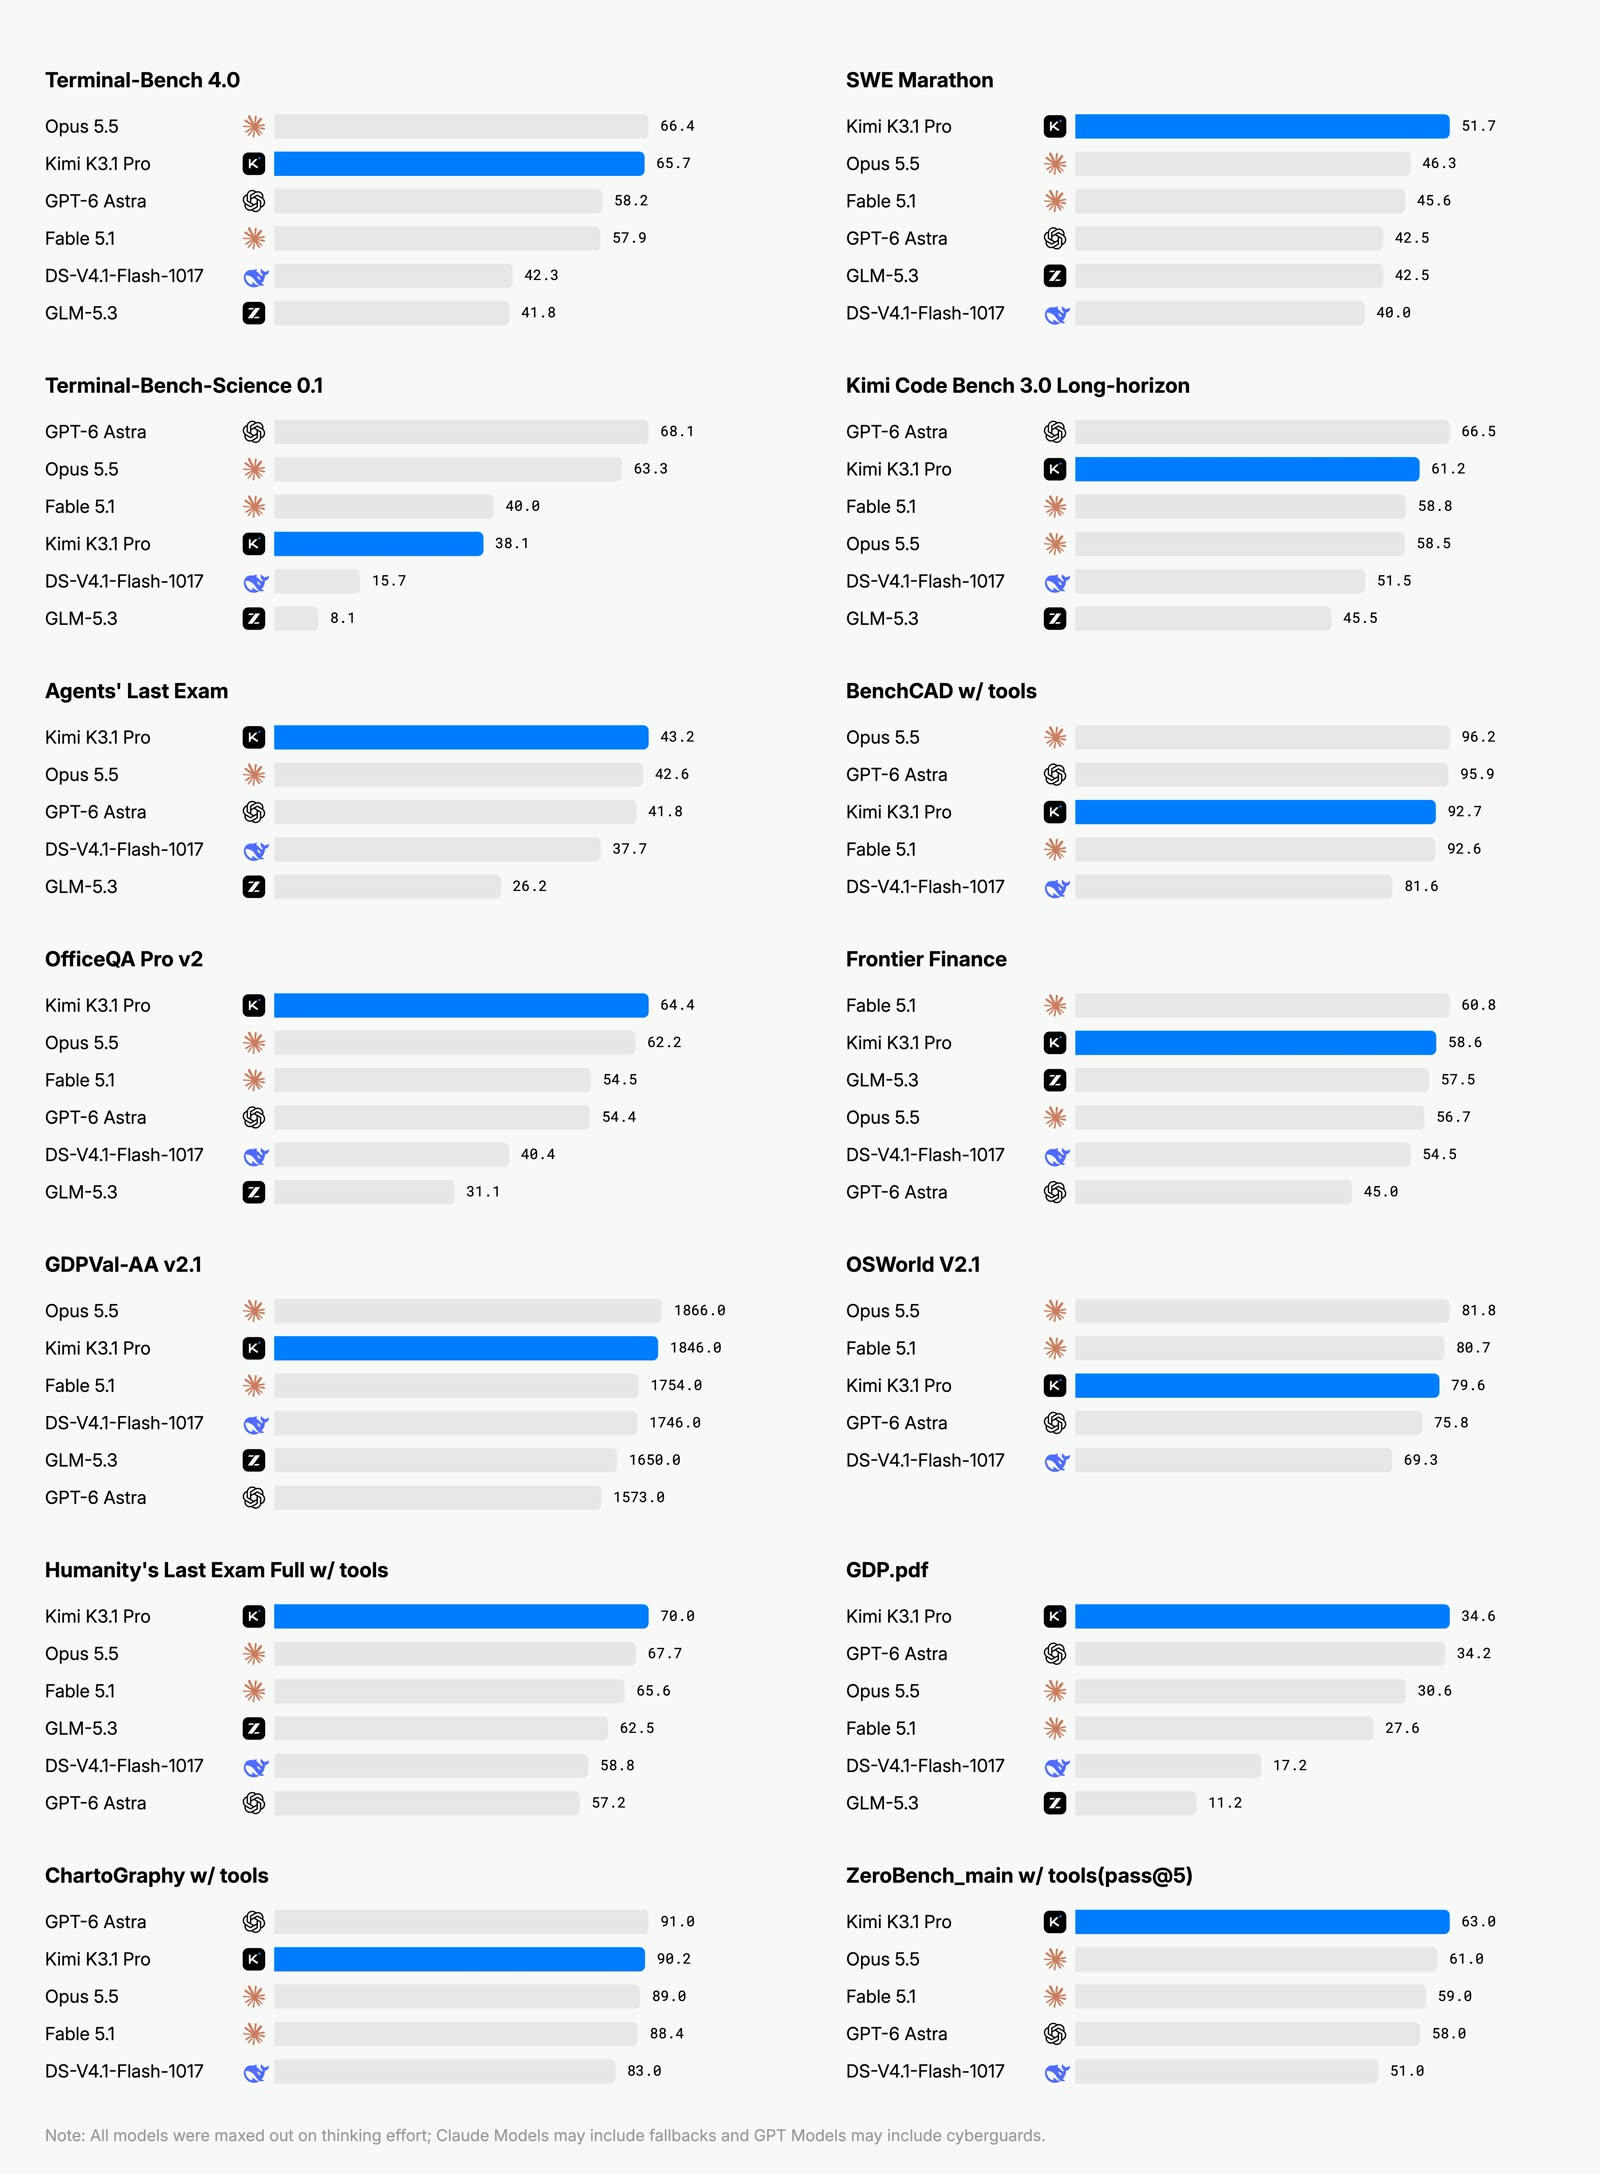
Moonshot AI's 2.8-trillion-parameter model scores 55 on Artificial Analysis, three points behind Claude Opus 5.5, costs half as much, and its full weights — the files that let anyone run it themselves — arrive by November 4.
Hugging Face's Carbon-X reads DNA like a language, answers in English
An open model lets anyone chat with raw genetic code — at a fraction of the cost of top paid tools.
 How it worksDeepSeek V3 architecture re-implemented in 190 lines of code, trained on a MacBook AirHerald of AI
DeepSeek V3 architecture re-implemented in 190 lines of code, trained on a MacBook Air
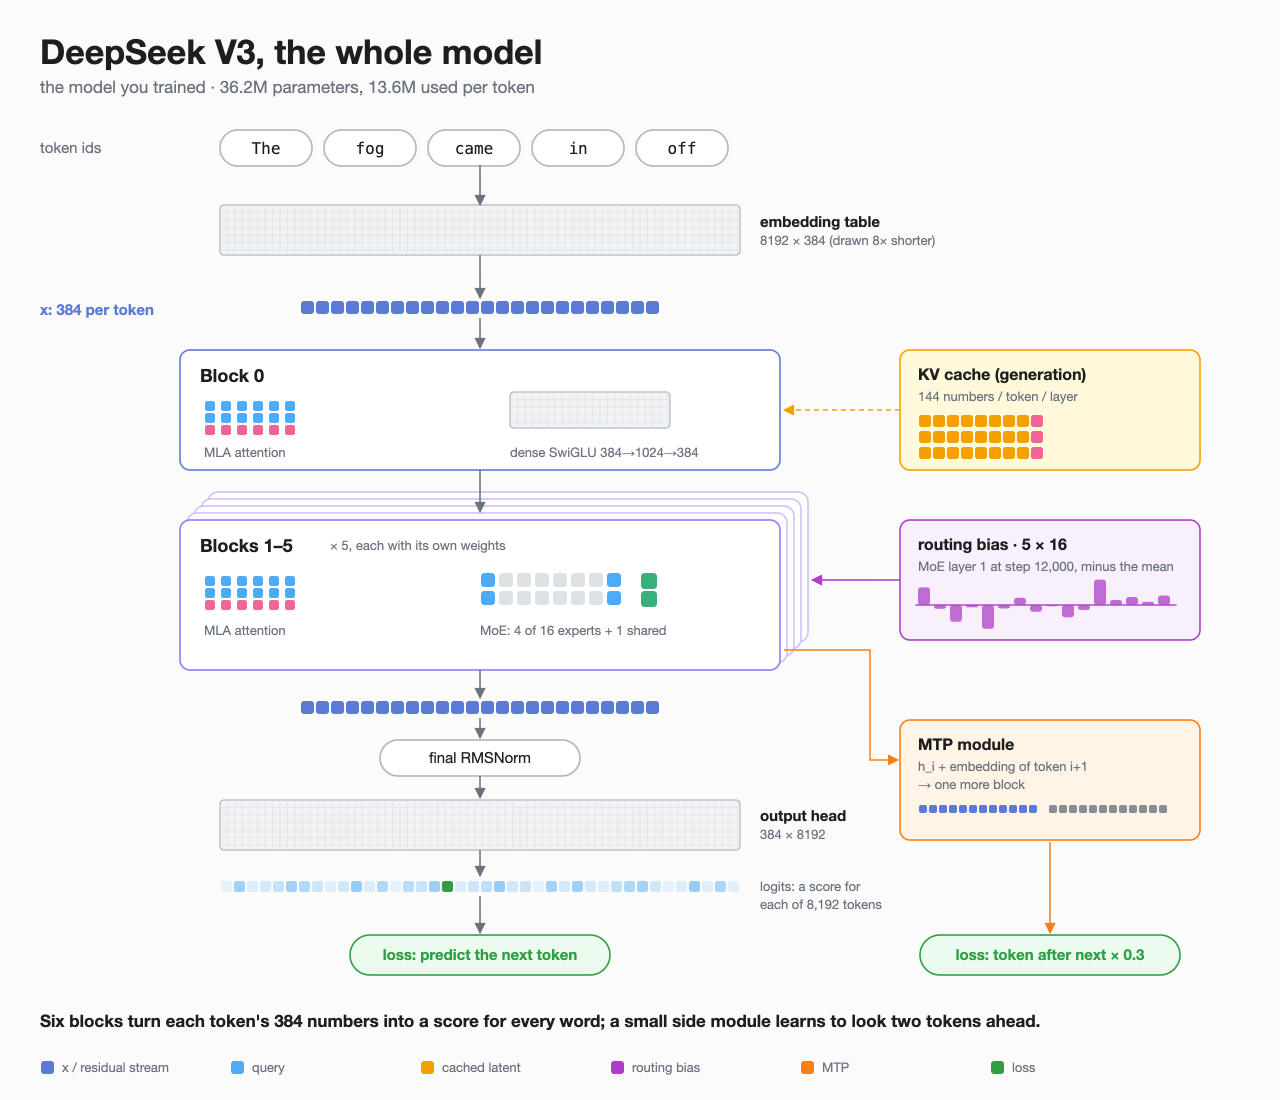
A developer showed how to fit DeepSeek V3's architecture into a tiny codebase — good for learning, not ready to chat.